

Figure 1. Multisectoral Nutrition Interventions

Many countries implement multisectoral nutrition strategies that address malnutrition through interventions delivered by different sectors, including health, agriculture, education, industry, social protection, and WASH. Populations are reached with a combination of individual, household, and/or community-level interventions that address common nutrition problems. For example, to prevent vitamin A deficiencies in young children, three or more sectors might deliver interventions:
- Health: high-dose vitamin A, SQ-LNS or micronutrient powders, counseling about feeding vitamin A-rich foods
- Industry: fortification of cooking oil with vitamin A
- Agriculture: promotion of orange-fleshed sweet potato for household production and/or consumption
Standard approaches to nutrition monitoring and reporting do not take into account whether the same individuals or target groups are being reached with multiple interventions. DataDENT has developed an analytical approach to quantify the integration of multisectoral nutrition interventions. The framework is flexible and responds to country information priorities and data availability. The aggregated indicators can be used to:
- Monitor implementation of multisectoral nutrition plans
- Identify synergies and inequalities in the mix of interventions reaching different population groups
- Target program adjustments to improve integration across sectors
- Monitor progress toward national and global nutrition targets in a more holistic way.
Co-coverage vs. composite coverage
DataDENT’s framework is rooted in the work of the Countdown to 2030 and the International Center for Equity in Health, Pelotas, which first developed methods for co-coverage and composite coverage analysis of health systems interventions to monitor Universal Health Coverage. In the first round of DataDENT, IFPRI carried out a co-coverage analysis of maternal and child nutrition interventions in seven South Asian countries (Countdown to 2030, 2020, Nguyen et al. 2022, International Center for Equity in Health 2025). Johns Hopkins team members developed composite coverage methods for the Exemplars in Global Health initiative (Exemplars in Global Health 2025).
Our multistep methodological framework integrates findings from recent scoping reviews of co-coverage & composite coverage methods in the literature. In the DataDENT framework, a key difference between co-coverage and composite coverage is the data sources used and the analytical methods required for aggregation (Figure 2).
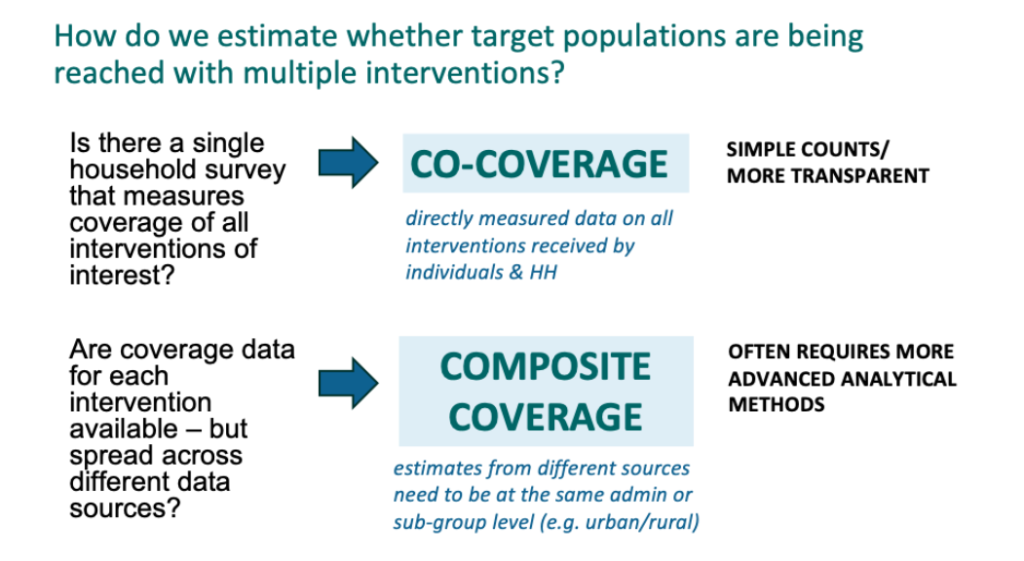
Figure 2. Comparing data sources for co-coverage and composite coverage analysis
In summary:
- Design the aggregated indicator in collaboration with data users and nutrition experts
• Identify guiding concept or “lens” for aggregated indicator
• Select relevant interventions from policy or strategic guidance
• Identify available data source(s) such as Demographic and Health Survey (DHS), Multiple Indicator Cluster Survey (MICS), nutrition-specific surveys, and administrative data
• Map relevant indicators in data sources
• Decide on an approach to the weighting of interventions
2. Calculate aggregated indicators
• Use modeling to fill gaps in representative data (composite coverage)
• Apply weights
• Normalize and scale for standardization and comparability
• Calculate confidence intervals
3. Validate the final indices to check accuracy, reliability, and validity
4. Design audience-specific communications
We piloted the framework in two country contexts: Bangladesh, in collaboration with icddr,b, and the Bangladesh National Nutrition Council, and Ethiopia, in collaboration with the Ethiopian Public Health Institute (EPHI).
Lens: We adopted three common lenses for the aggregated indicators and identified relevant interventions in each country’s policies and strategies. Our aim was to produce comparable co-coverage and composite coverage estimation approaches for the aggregated indicators.
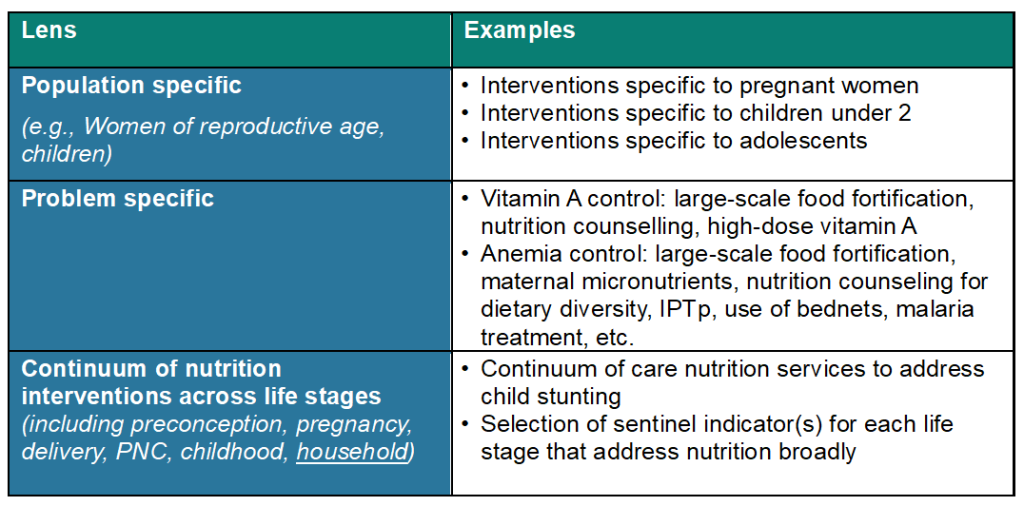
Figure 3. Common lenses for the aggregated indicators and relevant interventions
Data Sources: For co-coverage analysis, both countries had recent household surveys that collected coverage of interventions across sectors – the 2024 One Nutrition Coverage Survey (ONCS) in four districts in Bangladesh (Manohar et al. 2025), and the 2022 National Food and Nutrition Baseline Survey in Ethiopia (Meseret et al. 2023). For composite coverage, we used other nationally representative surveys (e.g., DHS, MICS, socioeconomic surveys, micronutrient and food fortification surveys) and administrative data.
Indicator selection: We selected relevant indicators in consultation with country and global experts and, as feasible, used the Lives Saved Tool framework to evaluate their relationship to priority nutrition outcomes (Walker, Tam & Friberg 2013, International Center for Equity in Health 2025).
Weighting: We tested three approaches for weighting individual interventions in the aggregated indicators. Option 1 assumed that all interventions included in a national policy were equally important (i.e., no weighting). Option 2 applied different weights to interventions based on evidence of impact on nutrition outcomes, and option 3 reflected country and global experts’ opinions on the relative importance of interventions.
Missing data: For composite coverage in Bangladesh, the available surveys were not representative at the district level, and so we used Bayesian spatial modeling to estimate individual intervention coverage in the four districts of interest.
Aggregation: We used the arithmetic means to compute summary co-coverage and composite coverage indices.
Validation: We used agreement and cross-validation between the co-coverage and composite coverage indicators. In Bangladesh, the agreement method was also used to compare and select single indicator estimates from the Bayesian small areas modeling estimations. In Ethiopia, where the survey dataset included nutrition outcomes, we correlated the aggregated indicators against the outcomes.
Data communication: We consulted with country actors about how to effectively present the data to users. To aid interpretation, it is important to present individual indicator estimates alongside the aggregated indicators.
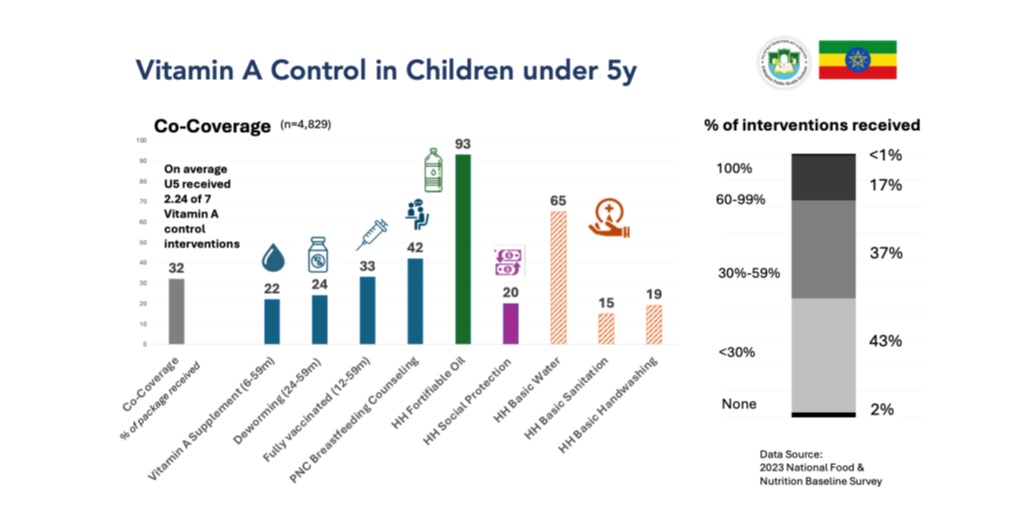
Figure 4. Presentation of co-coverage estimates for Ethiopia
What did we learn?
As countries implement their multisectoral nutrition strategies, tools like DataDENT’s co-coverage and composite coverage framework provide a way to measure integration and impact more meaningfully. Ideally, co-coverage analysis is possible because there is a single survey that captures all relevant indicators. However, we did find that multisectoral data exist across numerous sources, and composite coverage can be a feasible alternative to co-coverage. Data are often fragmented, inconsistently defined, and vary in population representativeness. Datasets integration required extensive indicator harmonization for comparability and stakeholder consultation to ensure contextual relevance.
Follow DataDENT on social media to know when co-coverage and composite coverage related outputs are available.