The Champions of Change (COC) Dashboard was developed by NITI Aayog to monitor district progress and aid in decision making. In our conversation with Rama Kamaraju, Data Scientist at NITI Aayog, we discussed the use of data under the Aspirational Districts Program (ADP) and how the COC Dashboard supports data-driven policy making in India. In 2019-2020, DataDENT implemented by the International Food Policy Research Institute (IFPRI) conducted a landscaping of 10 nutrition data visualization tools (DVTs) in India in collaboration with NITI Aayog, including the COC Dashboard. The study provided recommendations to DVT producers and users to strengthen the design and use of DVTs and insights were shared with NITI Aayog as well. This blog provides an overview of the COC Dashboard and also provides insights on how DVT study findings were adapted in the process of upgradation of COC Dashboard.
Q: What is the Aspirational District Program?
The Aspirational Districts Program is an initiative to improve social outcomes in 112 districts of India where socioeconomic outcomes have historically remained low. These districts have unique challenges in terms of connectivity (road as well as internet), infrastructure, health and nutrition, and education. The ADP brings together state governments and central line ministries under the aegis of NITI Aayog to carry out focused interventions. The program relies on three core principles: Competition, Collaboration, and Convergence. We have generated a sense of competition among the districts wherein they try to outdo the others in improving public service delivery. The program fosters collaboration as a platform for sharing best practices and convergence as the various line ministries and respective state governments maximize input of various government schemes in the Aspirational Districts. Lastly, the Prime Minister of India has emphasized a need to involve the larger citizenry in this process such that development can become a “mass movement.”
A key component of the ADP is the emphasis on data-driven governance and evidence-based policy at the district level. By engaging in regular monitoring and using district ranking, the program hopes to engender a data-driven approach towards governance at the district level, and efforts are being made to percolate further down at the block and panchayat levels.
Q: How do you monitor the progress of districts under ADP?
A bulk of the programmatic monitoring and evaluation revolves around delta rankings calculated and published as a ranked list from month-to-month, but we also collect some indicators on a quarterly and biannual basis. We conducted an extensive consultation with sectoral experts, various line ministries, and state governments to come up with the final rubric for ranking. To calculate the delta rankings, we collect 81 data points for each of the 112 districts and calculate 49 indicators across five thematic areas: 1) Health and Nutrition; 2) Education; 3) Agriculture and Water Resources; 4) Financial Inclusion and Skill Development; and 5) Basic Infrastructure. Given the emphasis on social outcomes, naturally the weights of indicators in Health and Nutrition, and Education are slightly higher than the other themes.

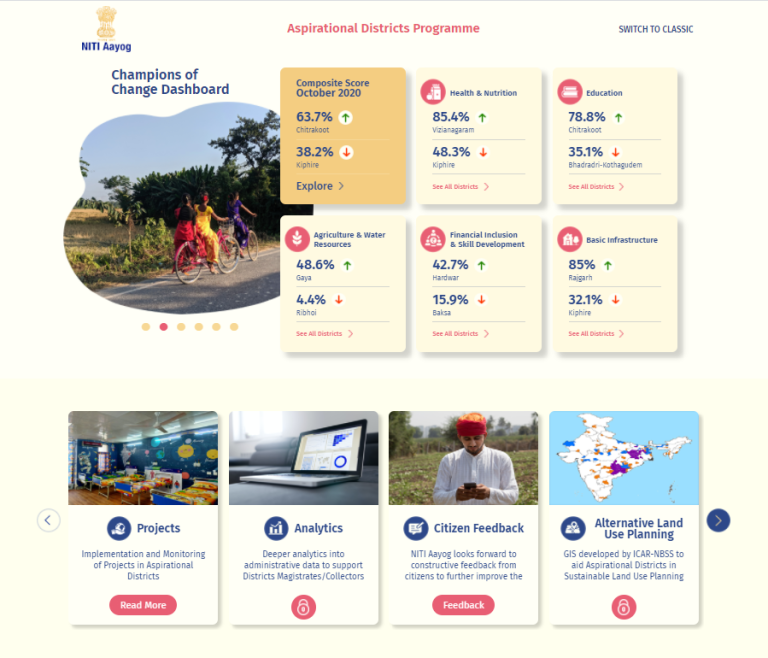
Figure 1: Champions of Change Dashboard. 14 December 2020.
The data come from a range of sources such as district line departments, central government schemes (e.g. HMIS data on some data points), and line ministries (e.g. Financial Inclusion data from Department of Financial Services, Ministry of Finance). The methodology to calculate delta rankings, and the forms to feed data and to collate other data points are processed via a data dashboard that we run. This dashboard aids us in publishing the ranks across thematic areas, as well as overall, and to analyze the data by indicator and region (i.e. District and State).
In addition to monthly delta rankings, we keep track of how districts are doing on an absolute basis compared to the baseline scores calculated at the start of the program. The combination of relative-monthly and absolute-overall performances helps us and the districts to monitor progress. The data that we receive from districts and that we collect from other sources is verified on a quarterly basis by third-party survey agencies. These data, collected at the household-level and representative at the district-level, help us in corroborating data we get from other sources and, additionally, as a high frequency survey data set from around 1,000 households per quarter per district.
Q: How does the COC Dashboard support data use and decision making? What is the role of data in policy decision making?
The COC dashboard is one of the Government of India’s focused efforts to emphasize outcome-based monitoring of public service provision. Most of the selected indicators are outcome indicators. We use the data to discuss challenges as well as best practices with concerned line ministries, state governments, and the district administrations and to come up with practical solutions to on the ground problems. For example, based on COC data, three-year action plans for each sector were formulated by line ministries and shared with all states and districts in March 2020. NITI Aayog also conducts periodic review meetings with line ministries to monitor the progress on implementation of these plans.
Data is at the center of these discussions and informs our decisions around policy and program priorities. For example, the Ministry of Health & Family Welfare has made conversion of Primary Health Centres (PHCs) and Sub-Centres (SCs) into Health & Wellness Centres in Aspirational Districts a priority based on data analysis that emerged from COC data (in combination with other sources). The National Council of Education Research and Training (NCERT), under the aegis of the Ministry of Education, had also planned to begin biannual learning outcomes surveys in all districts which will take place as soon as the schools reopen. The Department of Financial Services has shortlisted 40 Aspirational Districts and is working in mission mode to roll-out six government schemes relating to financial inclusion.
Our reviews with concerned state governments help us take up relevant issues with the District Administrations and their senior colleagues. We use these discussions to bring about convergence between central government and state government efforts to improve the administrative efficiency in these districts where needed.
Q: What recommendations from the India Data Visualization Tools (DVT) Study have you used to adapt the new COC Dashboard?
One key issue documented by the India DVT study—conducted by the Data for Decisions to Expand Nutrition Transformation (DataDENT) initiative and NITI Aayog—is the confusion of indicators and relevant data points among different stakeholders. The study findings also shared user interface challenges. While we learned about the study after we had already embarked on the upgrade, it was nevertheless helpful to learn about the issues that the report talks about. The upgraded COC Dashboard accounts for these issues by clarifying confusion among all involved stakeholders with the help of subject matter experts, and by improving the interface for use by both the public and internal government staff. The updated COC Dashboard’s data quality reporting mechanism is also generating a lot of internal discussions.
Q: What key features will be added/updated in the revised COC
Initially, the program relied on a dashboard which facilitated the delta ranking and reported thematic performance and indicators to the administrations as well as the public at large. However, to support the Prime Minister’s vision of creating block development programs at the state- and district-level, NITI Aayog engaged a technical partner in late 2019 to upgrade the digital infrastructure from a simple data dashboard to a holistic digital platform. The revised platform puts minimal load on the states and districts while providing them with the latest and easy-to-use technical tools (i.e. for analysis and project management) to work with data over simple web-based sessions.

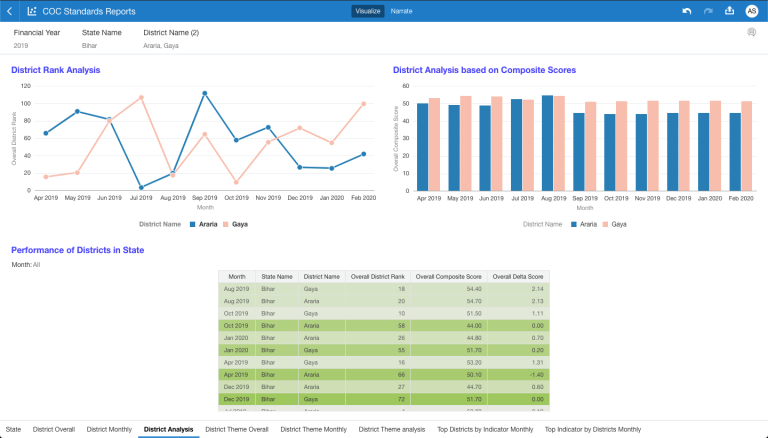
Figure 3: Sample Image of the Self-Service Analytics Tool now in use by districts. 2020.
In July 2020, during COVID-19 and in a period of less than 6 months, NITI Aayog developed and deployed the revised COC platform. The new platform utilizes advanced cloud computing technologies for long term data warehousing, advanced analytics techniques to improve the data systems, as well as overall data collection, organization, and analysis. It also incorporates geospatial data analytics tools to support the district administrations in developing Alternative Land Use Plans that meet sustainability goals for soil and water conservation. A Project Management module accommodates a fully digital workflow for capturing Corporate Social Responsibility (CSR) activities in the Aspirational Districts, as well as the development and monitoring of projects that Aspirational Districts are engaged in. The new platform also has a digital playground for carrying out advanced analytics using machine-learning algorithms.

