Brief (English – Letter) | PDF 475KB
Data file with mapped indicators | XLSX 115KB
Date of Publication | August 2019
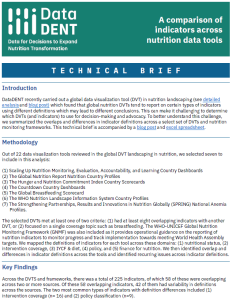
DataDENT recently carried out a global data visualization tool (DVT) in nutrition landscaping (see detailed analysis and blog post) which found that global nutrition DVTs tend to report on certain types of indicators using different definitions which may lead to different conclusions. This can make it challenging to determine which DVTs (and indicators) to use for decision-making and advocacy. To better understand this challenge, we summarized the overlaps and differences in indicator definitions across a select set of DVTs and nutrition monitoring frameworks.

