
Global Map
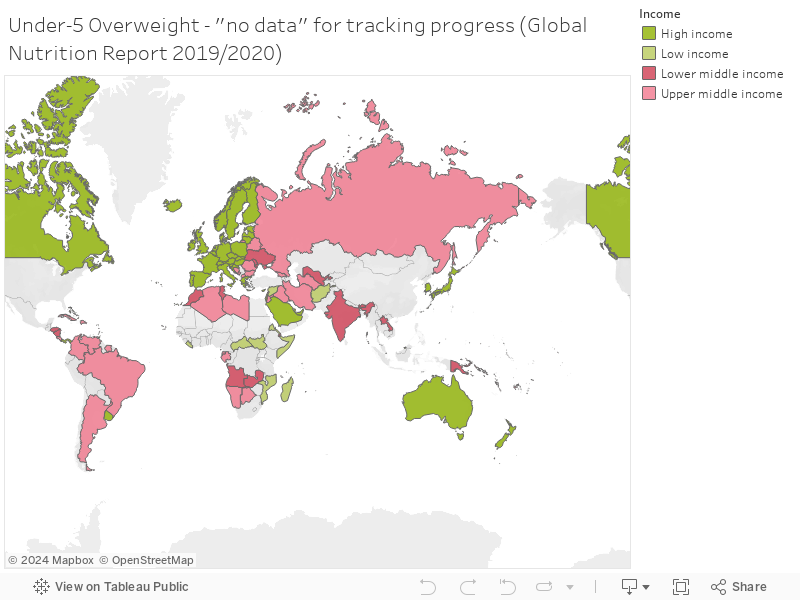
Maps can be used to compare data across geographical boundaries.
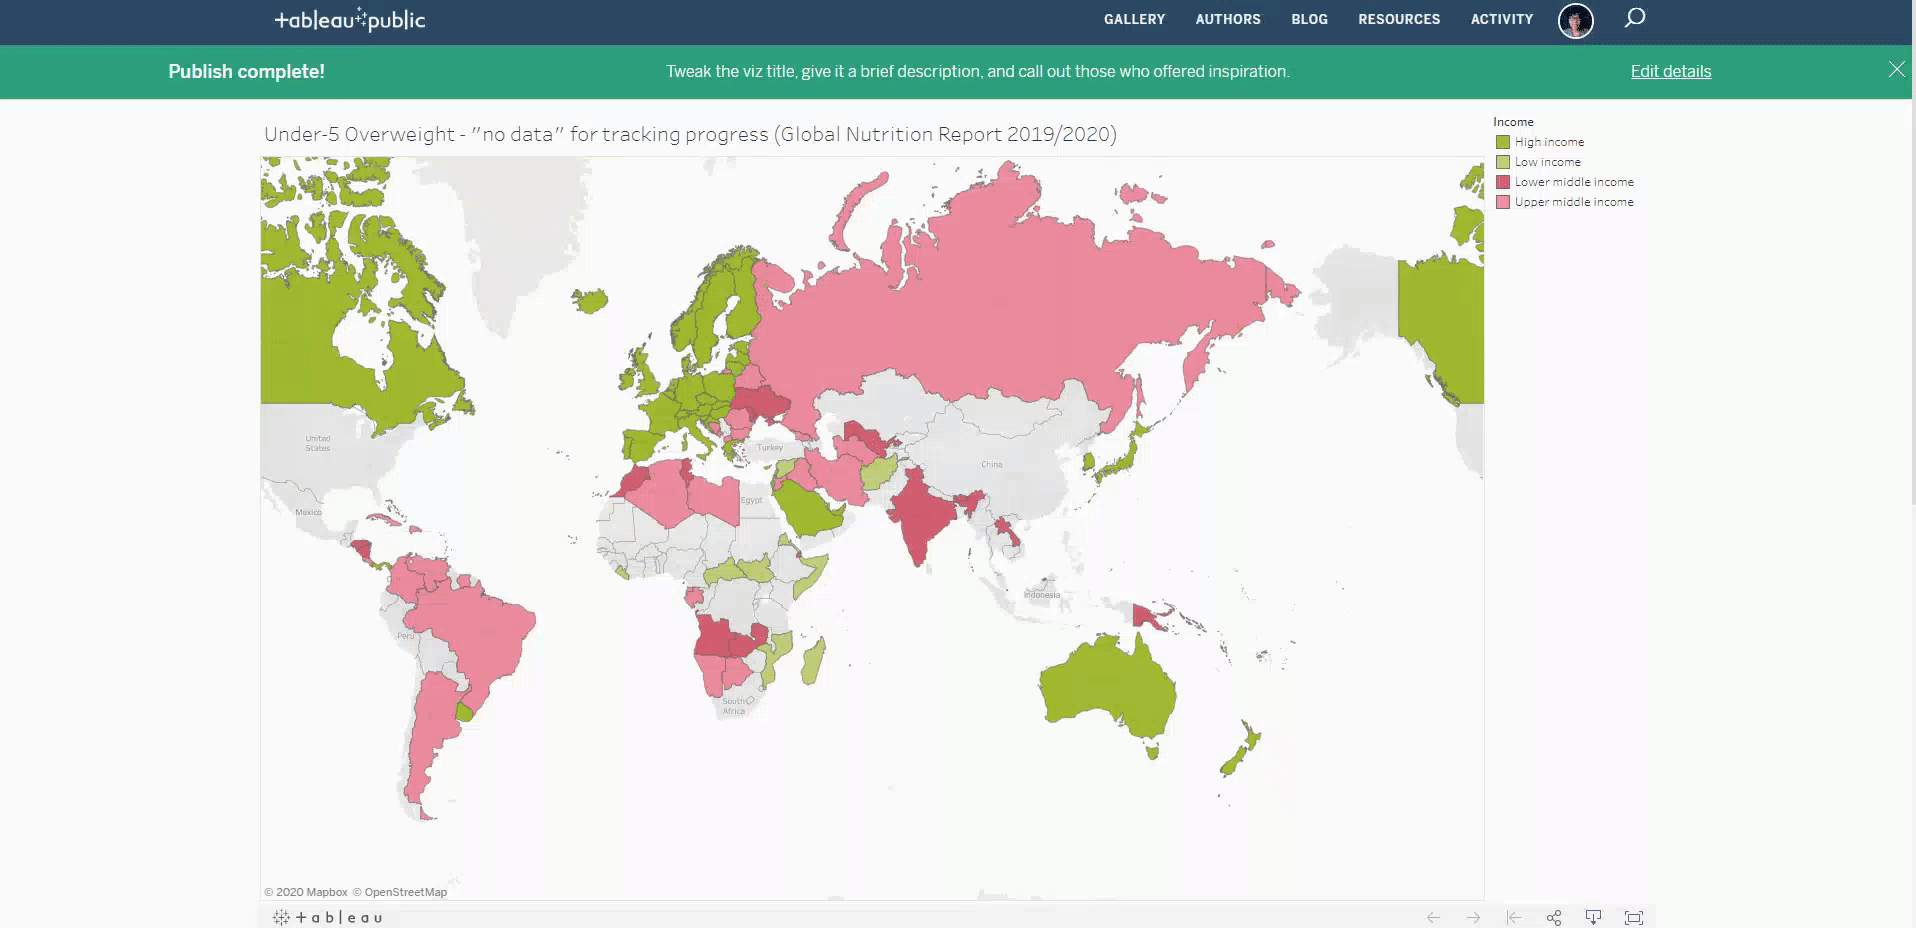
Data for Tutorial
Click here to download the Global Map tutorial data file. This data is from Global Nutrition Report, and the map was originally created for a DataDENT blog post on countries having insufficient data to track progress against nutrition targets.
Making Global Maps
Step 1: Connect data to Tableau Public.
• Load sample data file by clicking on “Microsoft Excel” in the Connect panel within the Tableau Public home screen.
• Select the file named “Global Map_overweight no data_GNR.xlsx” downloaded above.
Step 2: Assign data.
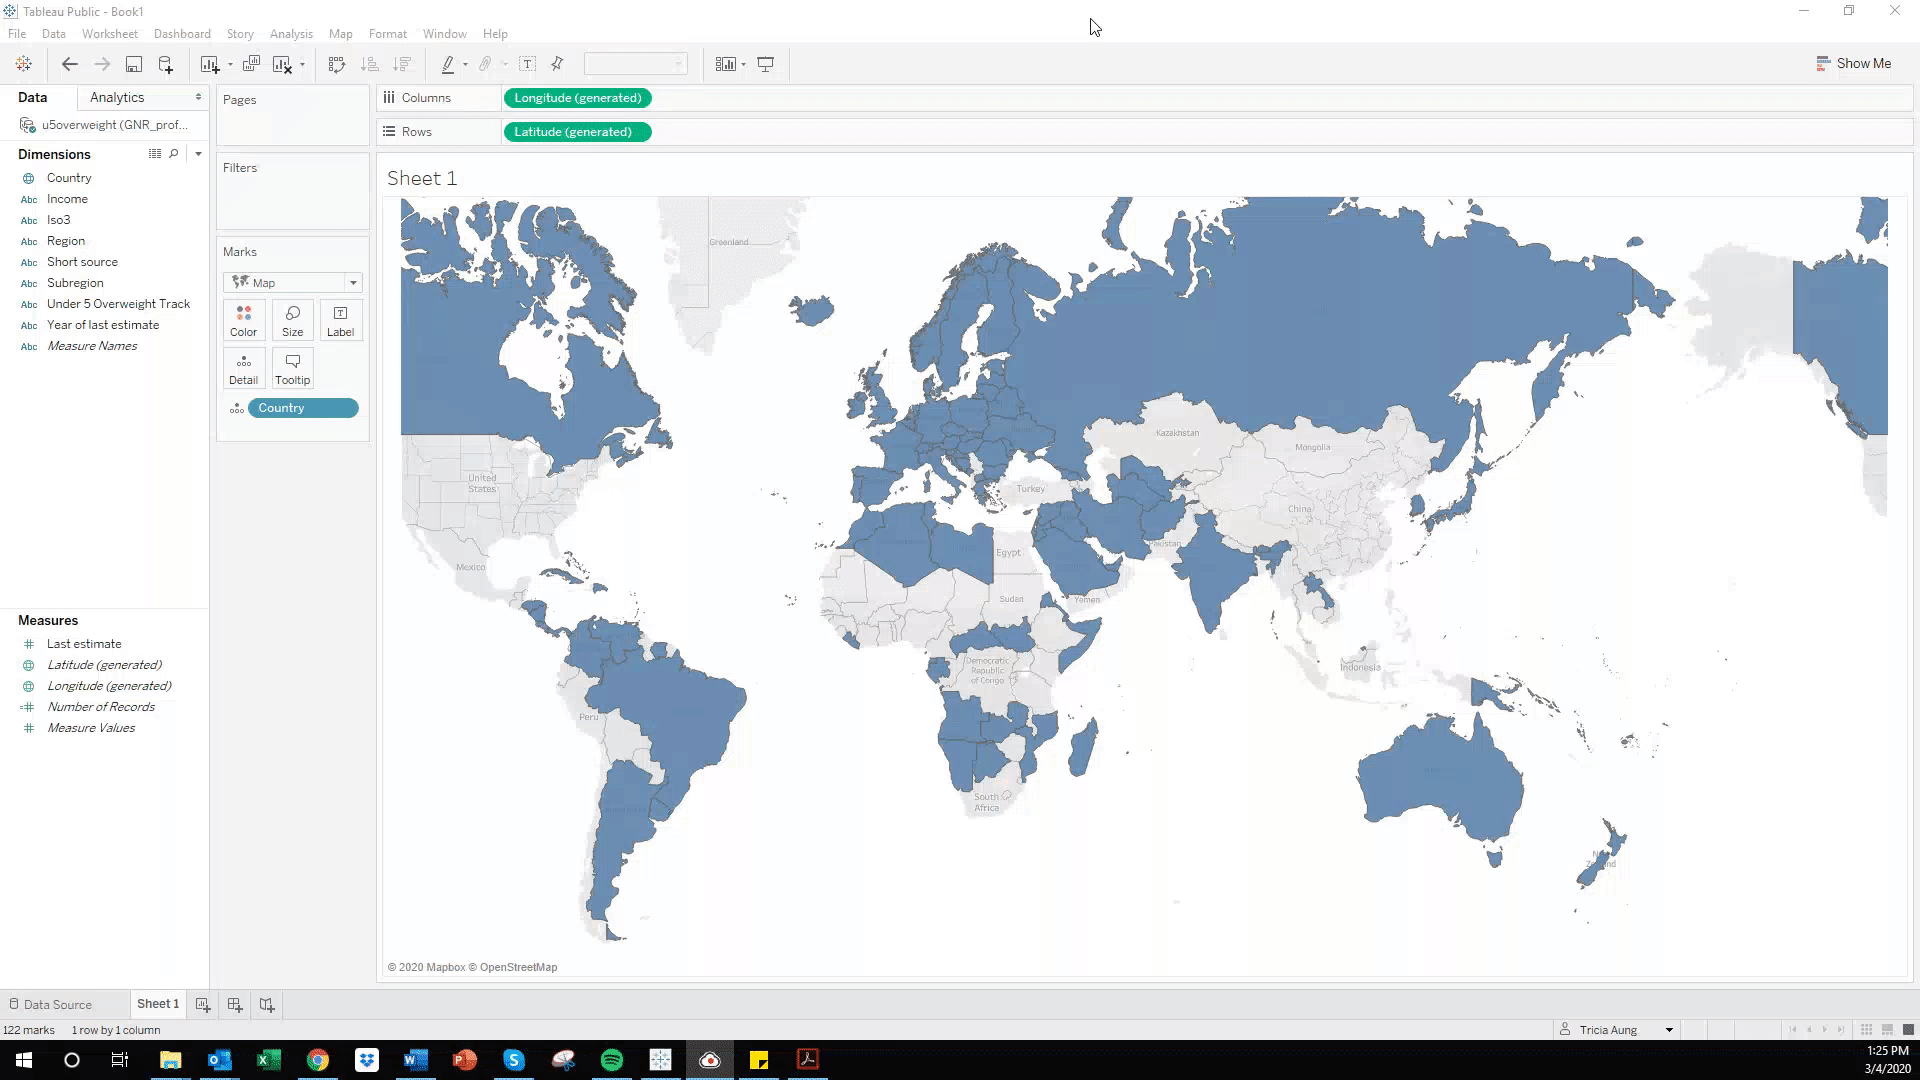
• Click on the worksheet tab at the bottom of the screen. You will build your data visualization within this worksheet.
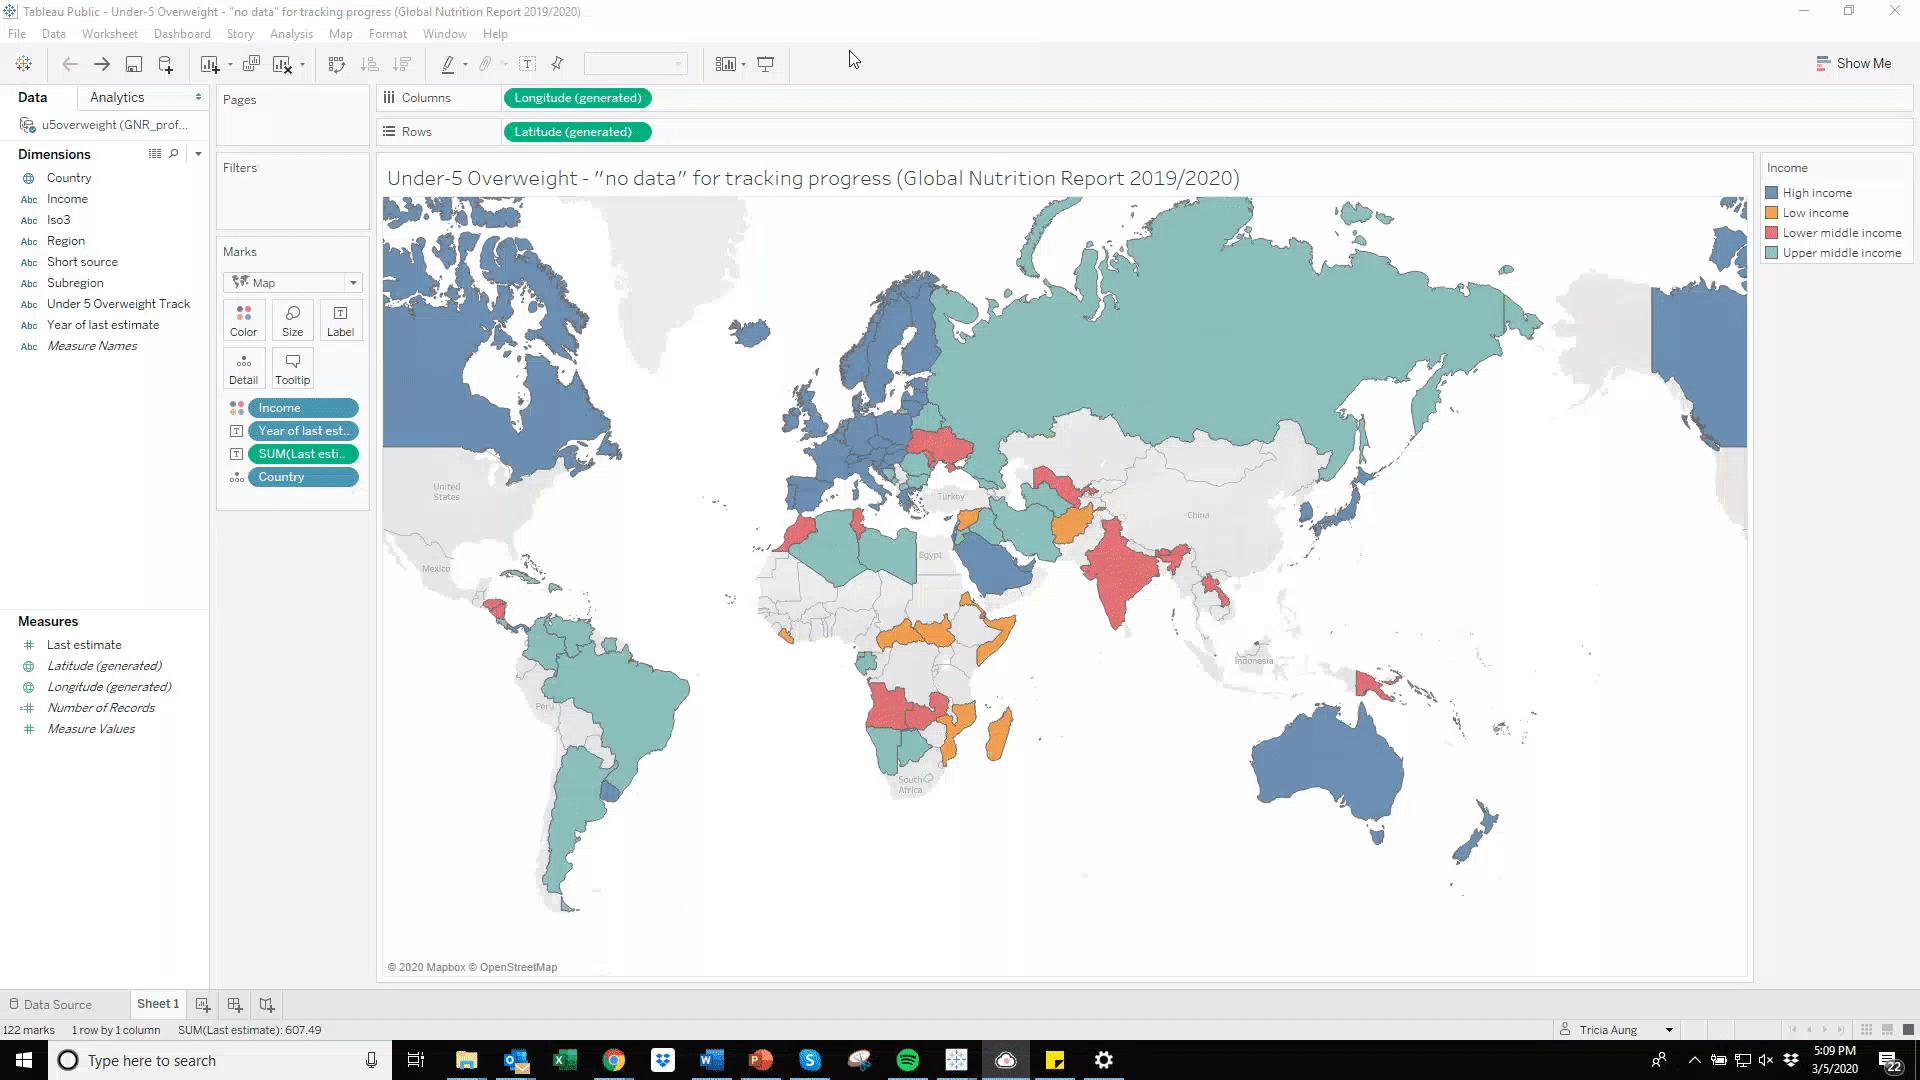
• In the Dimensions section, drag “Country” to the middle of the worksheet. In the Marks section, click the down arrow next to the default “Automatic” setting and select “Map.”
• In the Dimensions section, drag “Income” to the “Color” button and “Year of last estimate” to the “Label” button in the Marks section.
• In the Measures section, drag “Last estimate” to the “Label” button in the Marks section.
Step 3: Hide Labels.
• To hide labels, click on the “Labels” button in the Marks. Uncheck “Show mark labels.” Labels will still be visible if you hover your cursor!
Step 4: Add titles.
• To specify a title for your data visualization, double click “Sheet 1.”
Formatting Tips
Changing Colors
In the Marks section, click the “Color” button to change colors.
Saving Your Worksheet to Tableau Public
Click File, “Save Workbook to Tableau Public.” Your data visualization will be published to your Tableau Public account, which will open within your web browser.
Downloading and Sharing Your Data Visualization
While your data visualization is open in your web browser, click on the rectangle/arrow button (second button from the right) at the bottom to download your data visualization.
Click on the dots/line button (third button from the right) to get a direct link to your data visualization or download embedded code to place your data visualization on a website.
Links to DataDENT Tableau Tutorials
If you have any questions about these tutorials or would like to share your Tableau Public creations, please contact Tricia Aung (taung4@jh.edu).